28 Sep, 2023
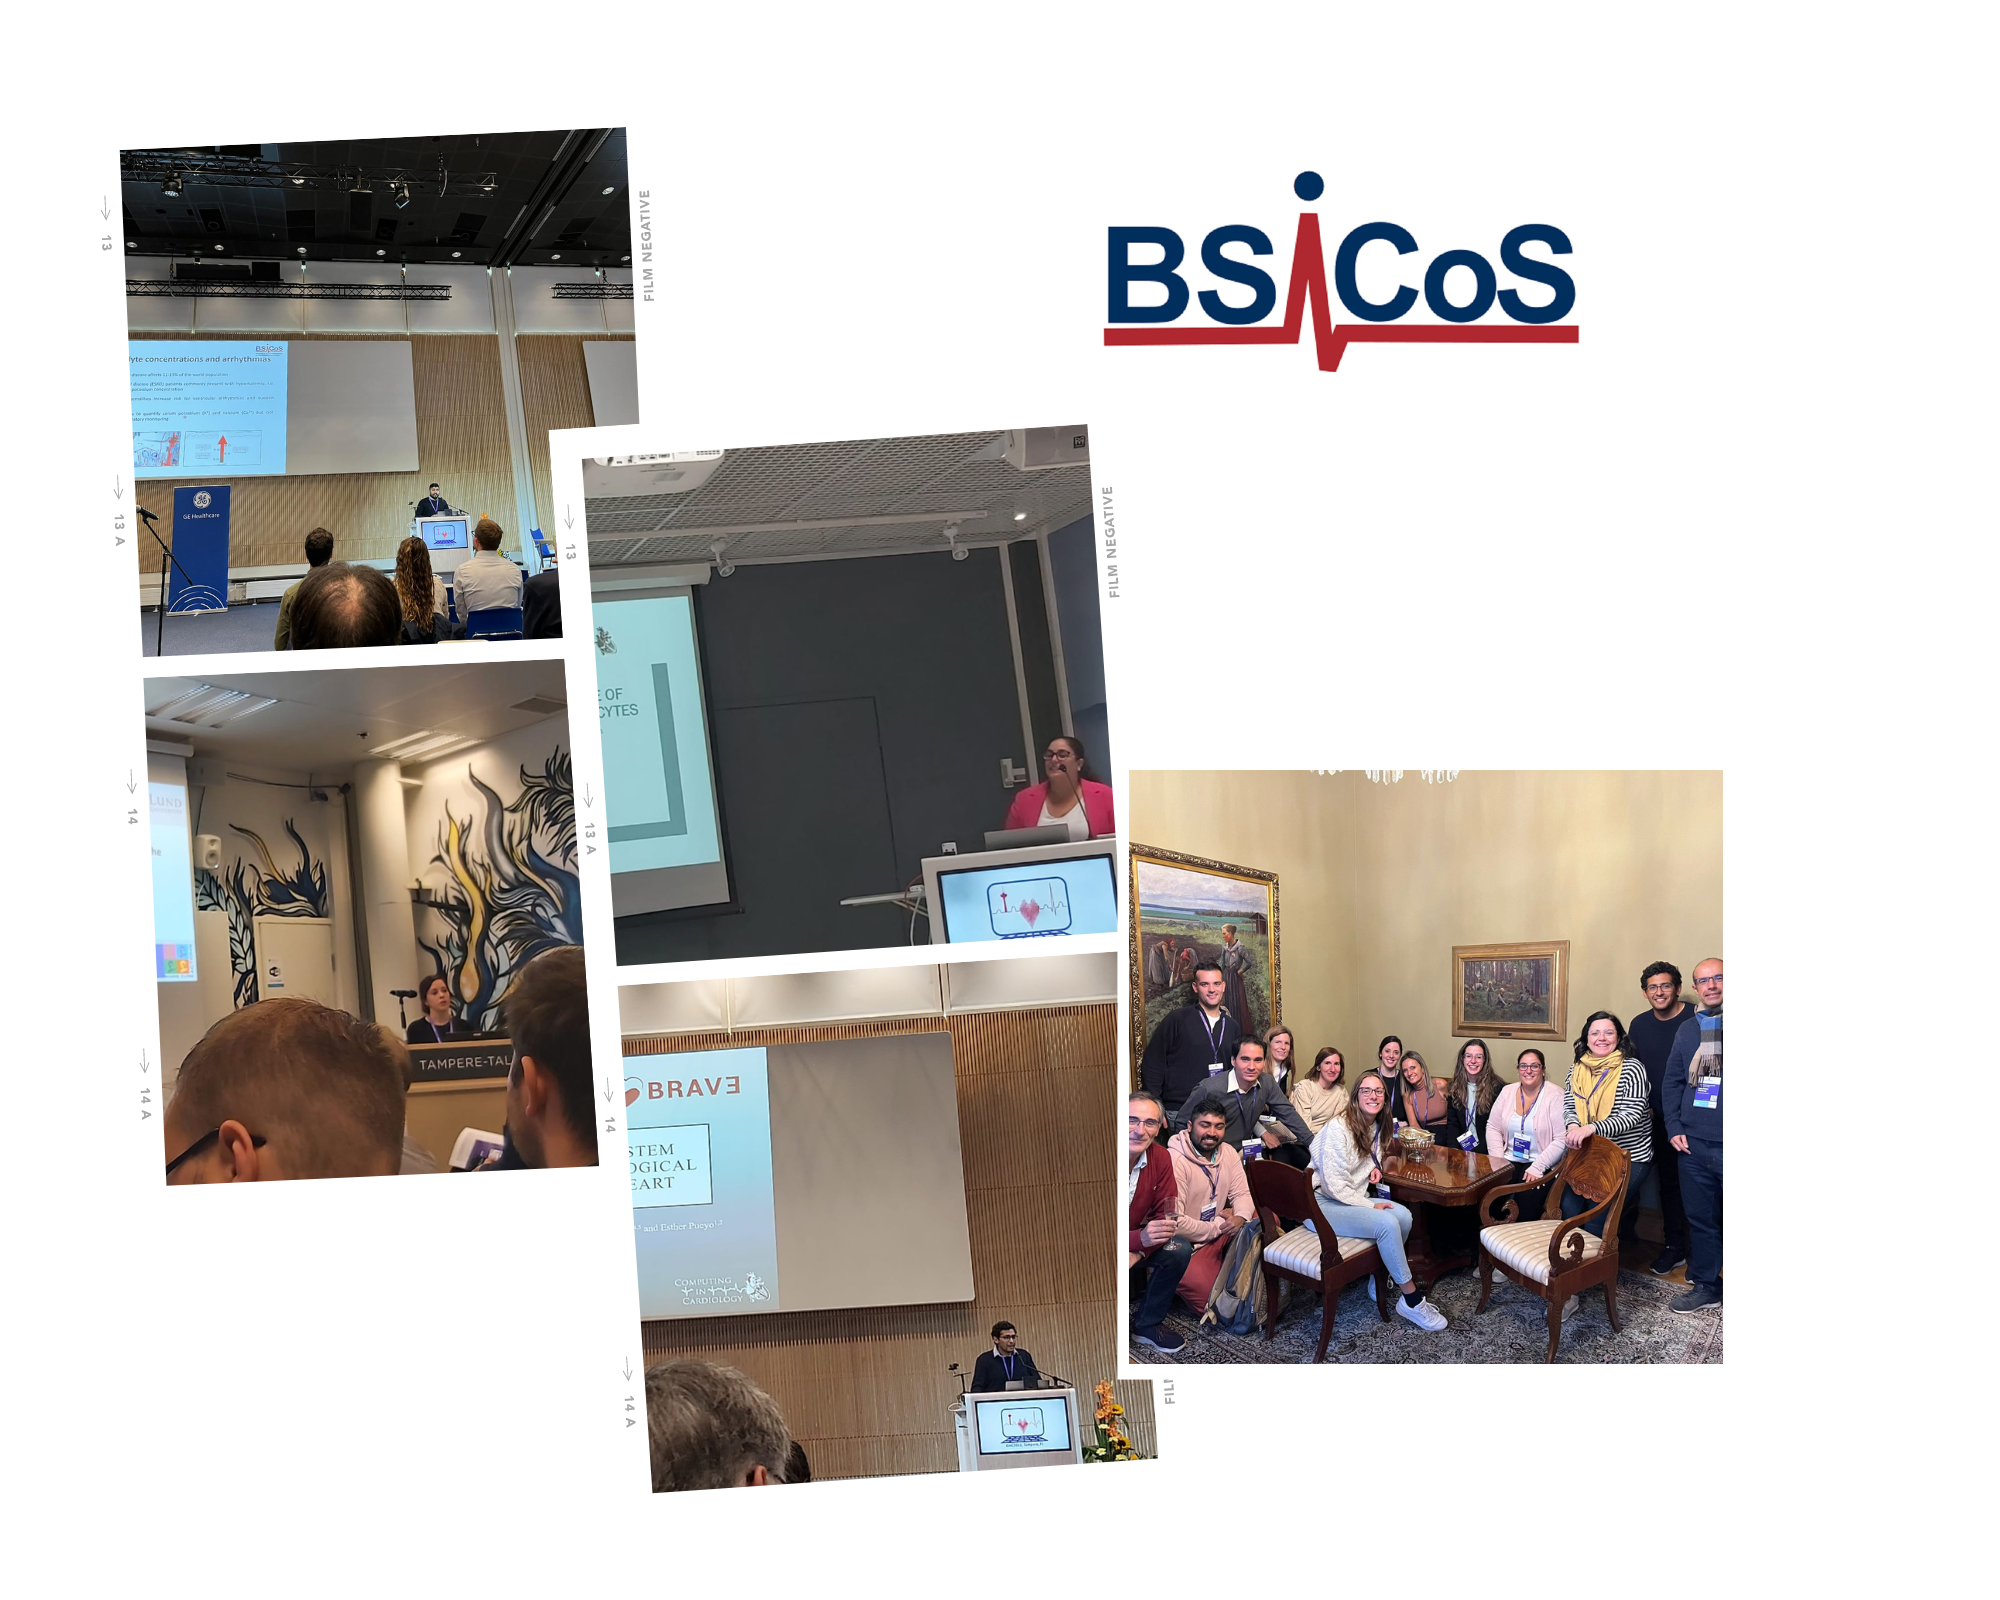
Computing in Cardiology (CinC) is an international scientific conference that has been held annually since 1974. The last conference was held in Tampere (Finland) at the beginning of September and our researchers presented their latest work there.
Maxi Rosales: “Ventricular Conduction System Modeling for Electrophysiological Simulation of the Porcine Heart”
Depolarization sequences triggering mechanical contraction of the heart are largely determined by the cardiac conduction system (CS). Many biophysical models of cardiac electrophysiology still have poor representations of the CS. This work proposes a semiautomatic method for the generation of an anatomically-realistic porcine CS that reproduces ventricular activation properties in swine computational models.
Personalized swine biventricular models were built from magnetic resonance images. Electrical propagation was described by the monodomain model. The CS was defined from manually-determined anatomic landmarks using geodesic paths and a fractal tree algorithm. Two CS distributions were defined, one restricted to the subendocardium and another one by performing a subendo-to-intramyocardial projection based on histological porcine data. Depolarization patterns as well as left ventricular transmural and inter-ventricular delays were assessed to describe ventricular activation by the two CS distributions.
The electrical excitations calculated using the two CS distributions were in good agreement with reported activation patterns. The pig-specific subendo-intramyocardial CS led to improved reproduction of experimental activation delays in ventricular endocardium and epicardium.
Clara Sales: “Right ventricular vs left bundle branch pacing-induced changes in ECG depolarization and repolarization”
Patients suffering from bradycardia are indicated for pacemaker implantation. Right ventricular pacing (RVP) has been conventionally used for this purpose, but it can increase the risk of atrial fibrillation and heart failure. Left bundle branch area pacing (LBBAP) has been proposed as a new physiological pacing technique. The aim of this study was to compare changes induced by RVP and LBBAP in the ECG. 10-minute 12-lead ECG recordings were acquired at baseline and after pacemaker implantation from 83 patients (31 RVP, 52 LBBAP). Median beats were calculated for each patient at baseline and post-implantation states. ECG markers including QRS duration (dQRS) and area (aQRS) and heart rate-corrected QT (QTc) and Tpeak-to-Tend (Tpec) intervals were measured. dQRS and aQRS decreased significantly at post-implantation with respect to baseline, both being significantly lower for LBBAP than RVP after pacemaker implantation. QTc was significantly reduced at post-implantation for both pacing techniques with no differences between them. Tpec did not change either between states or techniques. In conclusion, LBBAP led to more synchronized ventricular depolarization, supporting potentially improved clinical outcomes with LBBAP as compared to RVP for anti-bradycardia therapy.
Cristina Moreno: “Analysis of P-wave Changes for Prediction of Atrial Fibrillation Episodes”
Non-invasive markers of predisposition to atrial fibrillation (AF) can help to early AF detection and treatment. We focused on the analysis of ECG signals in patients with paroxysmal AF (PxAF). We hypothesized that, in sinus rhythm, the P wave widens, becomes more rugose and with higher complexity in the vicinity of an AF episode.We applied principal and periodic component analysis (PCA and πCA) as lineal spatial transformations and beat averaging to characterize the P wave in 5-minute segments in sinus rhythm. These segments were selected at 60, 30 and 5 min before each AF episode, thus allowing to study the evolution of the P wave features in the minutes previous to AF. The studied features were: power of the i-th transform component, PiΨ ,relative power of the second-to-first component, P2Ψ,r , relative power of third-to-first-plus-second component, P3Ψ,r and a measure of rugosity: the power of the P wave after high-pass filtering with a 30 Hz cut-off frequency, P1Ψ,HF,Ψ∈{PCA, πCA}, as well as the P-wave duration in the first principal and periodic component DΨmn. P2PCA,r increased as the AF episode approached. In fact it increased from 60 to 30 min (p = 0.009) and from 60 to 5 min (p = 0.002). Moreover DPCAmn increased from 60 to 5 min (p = 0.005) and DπCAmn also increased from 60 to 5 min (p = 0.011). No significant differences were found in the power or relative power using πCA. In the high-frequency powers using either of the two methods no significant differences were found neither. P-wave spatio-temporal features showed significant changes prior to the onset of AF episodes in PxAF, showing a more complex P-wave loop, and enlarging its duration as AF episodes approached.
Marta Gómez: “An in Silico Investigation into the Role of SK Channels in Failing Ventricular Myocytes”
SK channels are small conductance (∼10 pS) calcium-activated potassium channels. Although they have been suggested not to play a relevant role in healthy ventricles, SK channel upregulation has been reported in failing ventricles, with potential implications for arrhythmogenesis.
In this work, we aimed at uncovering the contribution of SK channels to ventricular repolarization in failing myocytes. To that end, we extended an in silico electrophysiological model of human ventricular failing myocytes by introducing the equations representing SK channel activity. To determine the value of the maximal SK current conductance, GSK, we simulated action potentials (APs) at different pacing frequencies and we fitted the changes in AP duration induced by SK channel inhibitions to available experimental data recorded under pharmacological interventions. The SK block-induced effects in our simulations were consistent with experimental evidence. Early afterdepolarizations were observed at pacing frequencies below 0.7 Hz only when SK channels were blocked.
In conclusion, our presented model of human ventricular failing myocytes integrating an SK channel formulation can allow dissecting the contribution of SK channels to ventricular repolarization and may help in understanding their role in arrhythmogenesis.
Chiara Celotto: “Effects of Acetylcholine Release Spatial Distribution on the Frequency of Atrial Reentrant Circuits: a Computational Study”
Electrical activation during atrial fibrillation is reflected in the ECG fibrillatory f-waves, whose frequency (Ff) shows significant variations over time. Cardiorespiratory interactions through the autonomic nervous system have been suggested to play a role in such variations. Here, we tested whether the spatial distribution associated with the release of the parasympathetic neurotransmitter acetylcholine (ACh) could affect the frequency of atrial reentrant circuits. Computational simulations in a human persistent-AF 3D atrial model, including AF-related electrical and structural remodeling, were performed. We evaluated two different patterns of atrial innervation: ACh release restricted to the area of the ganglionated plexi (GP) and the nerves departing from them, following the so-called octopus hypothesis, and ACh release distributed uniformly randomly throughout the atria. In both cases, ACh release sites occupied 8% of the atria. The temporal pattern of ACh release was simulated following a sinusoidal waveform of frequency 0.125 Hz (respiratory frequency). Different mean levels and peak-to-peak variation ranges of ACh were tested. We found that variations in the dominant frequency Ff followed the simulated temporal ACh pattern in all cases, with Ff modulation being more pronounced for increasingly larger ACh variation ranges. For the tested percentage of ACh release sites (8%), the spatial distribution of ACh did not have an impact on Ff modulation.
Hassaan Bukhari: “Inter-individual differences in cell composition across the ventricular wall may explain variability in ECG response to serum potassium and calcium variations”
Non-invasive monitoring of serum potassium (K) and calcium (Ca) concentration can help to prevent arrhythmia in kidney patients. Current electrocardiogram (ECG) markers, including the T wave width (Tw) and its time-warped temporal morphological variability (Dwu), correlate significantly with K and Ca but these relations vary strongly between patients. We hypothesized that inter-individual differences in cell type distribution across the ventricular wall can explain this variability.
We computed Tw and Dwu in simulated ECGs from a human heart-torso model at different proportions of endo-, mid-, and epicardial cells, while varying K (3 to 6.2,mM) and Ca (1.4 to 3.2 mM).
Electrical activity was simulated with a reaction-diffusion model with modified Ten Tusscher-Panfilov dynamics. Results were compared to data from 29 patients.
Tw and Dwu correlated strongly with K (absolute median Pearson coefficient r = 0.70 to 0.93) and Ca (r = 0.69 to 0.86) in simulations and in patients. Different cell type distributions reproduced inter-patient variability, with the same sign and magnitude of r.
In conclusion, the inter-patient variability in the relation between serum electrolytes and their ECG markers can indeed be explained by inter-individual differences in cell type distribution across the ventricular wall.
“Accelerating stabilization of whole-heart models after changes in cycle length”
Parameter changes can cause long-term drift in membrane models. To reduce he cost of whole-heart simulations with such changes the stabilization can be performed in isolated-cell models, but it can then still take many beats to stabilize the full model. We hypothesized that differences in activation time leading to cycle length (CL) variability before the first beat contribute to this. To remove this variability we froze most state variables of the model until the sodium current activated.
Simulations were performed with CL 400, 500, 600 and 1000ms and modified Ten Tusscher-Panfilov 2006 dynamics. Isolated endocardial, mid-myocardial, and epicardial cells were simulated for 1000 beats.
Their final states were then copied to a model of the whole human ventricles, which was run for 5~beats, with and without freezing.
Stabilization of the full model took three to four beats. Freezing of the membrane state accelerated stabilization in some cell types but caused opposite drifts in others. Drifts were largest in the epicardial and mid-myocardial layers, and not in particular at their interfaces.
Freezing of membrane state may help to accelerate stabilization but in our scenarios other types of drift dominate and may be aggravated by freezing, as it inhibits electrotonic interactions.
Marcos Usón: “Cosinor-Based Circadianity of T-Wave Alternans Activity as a Predictor of Sudden Cardiac Death in Heart Failure: a Post-Hoc Analysis of the GISSI-HF Holter Substudy”
Many studies in the last decades associate the existence of T-wave alternans (TWA) in the ECG to the risk of suffering malignant ventricular arrhythmias and sudden cardiac death (SCD). In this work, 24-hour Holter ECG recordings from 388 patients aged 65±10 years with heart failure were analyzed. Three Holter recordings were acquired for each patient, allowing to assess the evolution of TWA over 1-year period. We measured the index of average alternans (IAA), representing the average TWA activity along the whole recording, using a multilead fully automated method based on periodic component analysis (πCA) combined with the Laplacian likelihood ratio method (LLRM).
The IAA was also measured in 1-hour intervals, allowing to observe the influence of circadian rhythms on TWA. A circadian pattern was found showing the highest IAA values between 11:00 and 15:00 hours. The cosinor method was applied to adjust a sinusoidal wave to the results, finding that the MESOR (medium value of the adjusted sinusoidal wave) presented significant predictive power of SCD (Hazard Ratio: 3.33 (1.38-8.06), p=0.008) in the study population.
Neurys Gómez: “Time-warping based end-of-T-wave shape marker reflects repolarization changes during ischemia”
This work proposes to use a warping-based T-wave morphology index, dw, estimated only in the T-wave peak-to-end interval, to capture ischemia-induced dispersion of repolarization, avoiding the influence of ST segment elevation/depression. ECG recordings from 101 patients acquired during elective balloon percutaneous coronary intervention (PCI) were analyzed, together with their baseline recordings. A dw series was obtained by comparing the morphology of Mean Warped T wave peak-to end intervals (MWTPE) along the recordings with a reference MWTPE.
A relative marker, RPCAd, normalizing the dw changes during PCI relative by the magnitude of the change during baseline recordings, was used to quantify the relative morphological variations generated by ischemia. dw changes during PCI followed a well marked gradual increasing trend as inflation time progressed reaching at the occlusion end a median RPCAd value of 9.44 ms, (range from 1.01 to 80.74). During baseline recordings dw remained stable with median RPCAd value of 1.00 ms, (range from 0.03 to 2.93 ms).
Repolarization changes achieved RPCAd > 1, 2, 5, and 10 during PCI in 94.1%, 85.11%, 64.4% and 48.5% of patients, respectively, being significantly higher than its corresponding control recordings. In conclusion, the dw marker is able to quantify ischemia-induced repolarization dispersion changes in a robust manner independent of the ST changes.
Further Information:

